Exhibition
Exhibition went well, even if there was lack of visitors. I learned a lot about student loans, credit cards and taxes leading up to the final exhibition. I felt like my last few weeks in math went a bit slow, but I guess that’s supposed to be expected towards the end of the year. I feel like Lauren’s idea was really good, but if only there were more people and we didn’t have the tables too crowded with classmates, it would have been great. I learned a lot and really enjoyed having Lauren for a teacher.
|
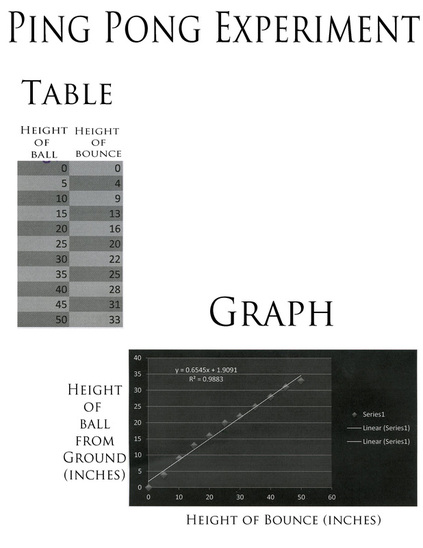
Linear Regression ProjectProcedure: For my experiment I looked at the correlation between the height of a ping pong ball and its bounce when you drop it. To collect my data, I used one ping pong ball and for each set of data, I would drop from a certain height and then record its bounce off the ground in inches. I recorded 11 sets of different heights the ball was dropped at. Each time, I took the height up 5 inches.
Predictions: If I was to drop the ping pong ball from 100 inches, I believe that, according to my equation y=.65x+1.91, that the ball would bounce off the ground to the height of 1241.5 inches. If I was to drop it from 75 inches, it would reach 50 inches on the bounce, according to my equation. I am pretty sure that this equation and the answers I got from it are pretty close, because the R² is .99 which is very close to 1, showing that the correlation between these two variables is very close. Reflection and Conclusion: The regression equation of this data shows that when I use it to predict future data points, I can be positive that the answer I will get will be right since the R² is very close to 1 and it is almost very linear. The slope represents the change of the height of the ping pong ball’s bounce after dropping it from 11 different heights. The y-intercept, which this case is 0, represents which the height of the bounce will be when you drop the ball from 0 inches. |
